No dolphins were harmed in writing this article.
At first reading, the recent report on national water quality from Land and Water Aotearoa (LAWA) seems to suggest, as did their publicity around its release, that water quality in New Zealand is finally improving.
However, closer investigation of the report reveals some awkward issues that could undermine any optimistic conclusion. Firstly, the report is based on data from a set of outdated and flawed assessments that measure a narrow aspect of freshwater condition. The flaws include the parameters used and how they are measured. Secondly, the claims of improvements were based on a small proportion of the data. Finally there are some issues around the lack of scientific or objective rigor in the selection of the monitoring sites.
LAWA is made up of the regional authorities charged with protecting water quality in New Zealand and was set up to share information after their efficacy was publicly challenged, particularly over the condition of the Manawatu River. This has, however, sparked a number of issues. Councils are now using platforms like the LAWA website to report on their own competence as environmental protectors, but without independent checks on the validity of the data presented, no way of knowing what data is not being presented, and no higher authority to oversee the reporting or to complain to. Consequently, this situation incentivises councils to ‘cherry pick’ data with good news stories.
Conversely, the scientifically/objectively chosen sites in the National River Water Quality Network (NRWQN) data show the opposite result to the LAWA report and other reports show increasing nitrate loss and intensification. This suggests that the data used for the LAWA report are not representative of the true picture.
Regardless of potential problems from a lack of transparency and objectivity with the LAWA report, what it does reveal are some serious flaws in the way we measure freshwater quality in New Zealand, at least for the restricted set of parameters included in the report analysis. The measures are flawed in many ways, which I will detail individually below, but crucially there are no measures of habitat or ecosystem health. As a simplistic example of why this is important is that a swimming pool has perfect water quality, but no aquatic life could or would want to live in it.
I suspect that the heart of the problem is that some agencies don’t really want to know the answer. So they carry on measuring the wrong things the wrong way. For example, despite scientists having long known that the parameters of water quality in the LAWA report all vary hourly, daily, seasonally, and in relation to flow and rainfall, they are only measured once every month.
I am not implying a conspiracy here; rather I see it as more of a legacy issue, because the measures and way they are measured come from a time when water quality was not seen as important. Regrettably, however, at least with the data presented in the LAWA report we are still collecting the same data in the same way as we did more than three decades ago. This is despite major improvements in our knowledge and the technology available to measure additional things in more meaningful ways.
Below are the water quality measures used in the LAWA report and their potential problems:
- E. coli – this is one of a suite of indicators of faecal contamination that are potentially threatening to human health. Problematically, E. coli levels in freshwater are extremely variable depending on rainfall, so monthly sampling will miss almost all this variability. Additionally, faecal contamination does not cover the many other potential human health issues like toxic cyanobacteria.
- Clarity and turbidity – these are both measures of sediment suspended in water. However, from an ecosystem health perspective, they are of much less importance than the sediment that ends up on the riverbed smothering habitat and life (known as deposited sediment). But deposited sediment is not included.
- NH4 (ammonium) – this can be toxic to aquatic life, but is generally only high enough to be an issue in waterways immediately downstream of out of pipe discharges (point sources). This means the results are very dependent on sample site placement in relation to such discharges.
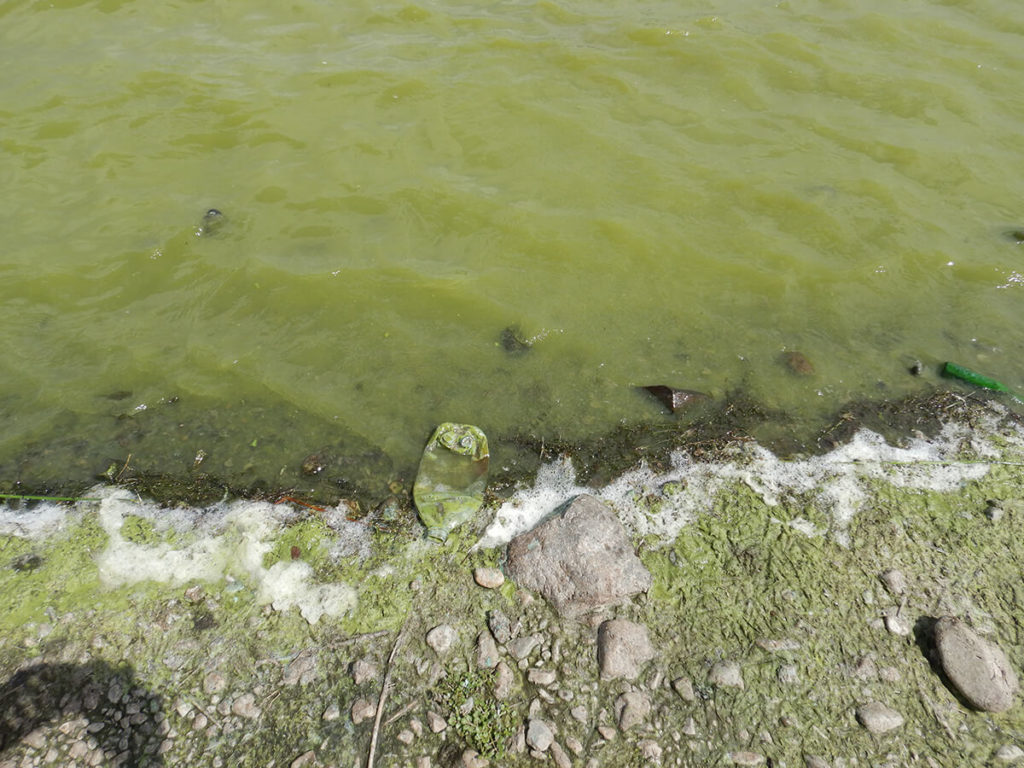
- The rest of the nutrient measures Total Nitrogen(TN), Total Organic Nitrogen(TON), Dissolved Reactive Phosphorus(DRP) and Total Phosphorus(TP) are just different forms of nitrogen and phosphorus. The reason they are measured is because when they are in water in excess they lead to excess algal growth which leads to other ecosystem health issues, which are described below. We have long known these nutrient measures vary by orders of magnitude seasonally and even daily in relation to flow and uptake by algal mats. Thus, monthly sampling misses most of this variance. More worrying is the fact that the nitrogen in the water reduces as algal mats form and bloom. Therefore, much of what is claimed as improving water quality can be excess algal growth taking up the nitrogen (removing it from the water to grow). Think about how irrational this is – when the reason nutrients are measured is to guard against algal blooms.
- Phosphorus is required by algal mats too, but mats grow on the riverbed thus they sit in and on sediments that are high in phosphate. This means it is of little or no consequence how much phosphorus is in the monthly grab water sample because the alga have all the phosphorus they need for growth in the sediment. There can be almost no detectable phosphorus in grab samples but algae still becomes excessive, negating the point of measuring phosphorus in rivers.
A graphic example of how all these measures completely fail to assess ecosystem health is the Hopelands Road site on the Manawatu River. In this case, excess nutrients drive excess algal growth which then leads to extreme oxygen fluctuations. The fluctuations result in oxygen depletion to levels harmful or lethal to stream life. Conveniently for this explanation, Horizons Regional Council measure dissolved oxygen continuously at three sites, including Hopelands Road, and they make this data available in real-time on their webpage so we can see what is happening.

If you look at dissolved oxygen measures for the Hopelands Road site over the past 12 months (available on the Horizons website), you can see graphically how in summer, when flows are low and water is warm, the oxygen levels go through massive daily swings. This is typically what happens in nutrient polluted systems when algal biomass builds up (blooms) because, like all plants, the alga respire the take almost all of the oxygen at night.
These extreme fluctuations in summer mean the dissolved oxygen levels go way outside the limits proposed by NIWA, the ANZECC guideline limits, as well as the USEPA and UK environment agency limits.
Conversely, if you go to the LAWA webpage and look at the same site you will see that it scores an ‘A’’ for everything. It is also worth noting that this site is one of the sites that made the Manawatu River infamous (a decade ago), and has not changed much in the meantime.
This site has a median nitrate value around 0.6 mg/m3, ten times less than the National Objectives Framework (NOF) nitrate toxicity bottom line (6.9 mg/m3). Thus, it scores an ‘A’, but it regularly has dissolved oxygen depletion rendering it lethal to aquatic life (driven by excess nitrogen, leading to algal proliferation, leading to oxygen depletion).
This shows how the nitrate toxicity classification is nonsense. When nitrate is so high it becomes toxic is beside the point because the oxygen levels become unliveable at nitrate levels 10 times lower than toxicity. The fish and other aquatic life cannot die twice.
Thus, nitrate toxicity should not be included in this type of reporting, and was never intended to be used in this way. Pointing out that a site scores an A for nitrate toxicity is like me saying that no dolphins were harmed in writing this article.
Most people would logically assume looking at the webpage that a site that scores A must be excellent, and that if it is an A and the LAWA page says it’s in the worst 50% of streams in New Zealand, then it suggests all streams in New Zealand must be excellent. This is a dangerous deception because it leads to people not taking our freshwater crisis seriously, allows deniers to mislead, and reduces the chances of the necessary changes occurring.
There are much better ways to measure freshwater health and many measures of ecosystem health that have been developed and used by councils and would likely give a very different picture if they had been included in the LAWA report. The most common ecosystem health measure is the Macroinvertebrate Community Index (MCI). This is much better than the water-quality measures described above as it does to some extent integrate them as well as habitat condition and changes in water quality over time.
As indicated by the oxygen measures from the Horizons webpage above, the technology is available to measure continuously for many parameters including most of the monthly samples used in the LAWA report. Continuous monitoring is being used all over New Zealand and is revealing comprehensively the inadequacy of the monthly snap-shot samples.
In conclusion, I believe the LAWA website is a valuable asset to allow the New Zealand public to look at water quality in their region. However, it’s important that users are aware of the limitations of what is presented and how it is presented given the pressure on council staff to tell a positive story. I think that by presenting a report like this one, LAWA have gone beyond their remit. It is irresponsible and moving into dangerous territory because perhaps the worst thing for freshwaters in New Zealand is a false impression that net improvements are being made before the necessary changes are actually made.


Leave a comment