New Zealand has to deeply cut its domestic greenhouse gas (GHG) emissions, as do the 156 other countries that have now ratified the Paris Climate Agreement. Whether in the short term we buy international carbon credits (who from and for how much?), or whether we convert more marginal pasture land back into forests as carbon sinks (until eventually NZ is covered in trees?), both can only be temporary options to buy some time. Sooner or later, we will have to decarbonise the economy by reducing our domestic emissions – and sooner will be more effective and cheaper than later.
The transport sector (including domestic aviation and shipping in the statistics, but largely excluded from the discussion) has high potential to contribute to decarbonisation strategies, just as it has done elsewhere- in the Scandinavian countries for example. This link is based on personal experiences from a two week cycling tour of the Oslo Fjord, North Zealand, Kullen Peninsula Sweden, Oslo and Copenhagen in June 2017. The topic was also discussed in an RNZ National “Sundays” programme interview with Wallace Chapman on 27 June, 2017.
New Zealand’s gross GHG emissions in 2015 had increased by around 23.3% since 1990 (Table 1). By way of comparison, Denmark, a similar size country also with a significant agricultural sector, had reduced its emissions by around 26.3% over the same period.
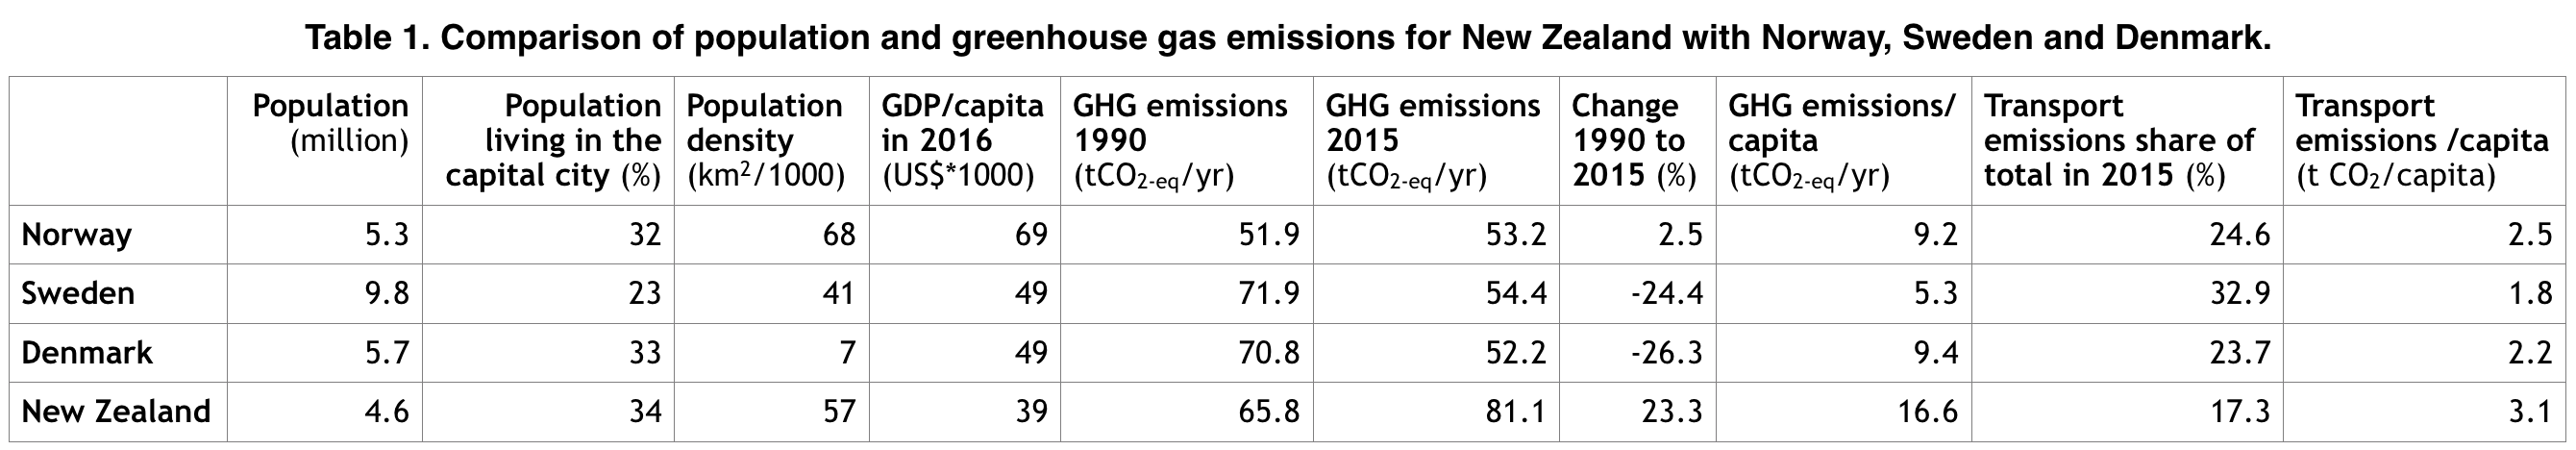
For the transport sector, New Zealand’s GHG emissions have risen 78% in total since 1990 with per capita transport emissions rising from 2.6 tCO2 in 1990 to 3.1 tCO2 in 2015. Denmark’s total transport emissions rose only 13% from 1990 to 2015 and on a per capita basis they remained stable at around 2.2 tCO2/yr. Norway’s transport per capita emissions were 2.5 tCO2 in 2015 and Sweden’s were 1.8 tCO2.
So how have these three Scandinavian countries, (that are not that dissimilar to New Zealand other than their greater wealth in terms of GDP per capita, Table 1), managed to achieve significantly lower GHG emissions from their transport sectors?
Rail network
Light rail is common in Scandinavian countries (Fig. 1). Around one third of the Danish population live in metropolitan Copenhagen, being a similar portion to the number of New Zealanders who live in Auckland. Yet compared with Auckland, the greater Copenhagen municipality has an extensive rail and metro network with over 100 stations.
Overall there are 2633 km of rail network in Denmark, some already electrified. As part of a political agreement on green transport, a government policy objective is to make the entire rail network independent of fossil fuels. Electrification work has already begun on nine separate lines around the country and the current target is to complete the task for the entire network by 2026. As well as achieving a significant reduction in transport GHG emissions, an additional co-benefit is the faster speed that the electric trains can travel compared with diesel locos, thereby leading to shorter journey times.
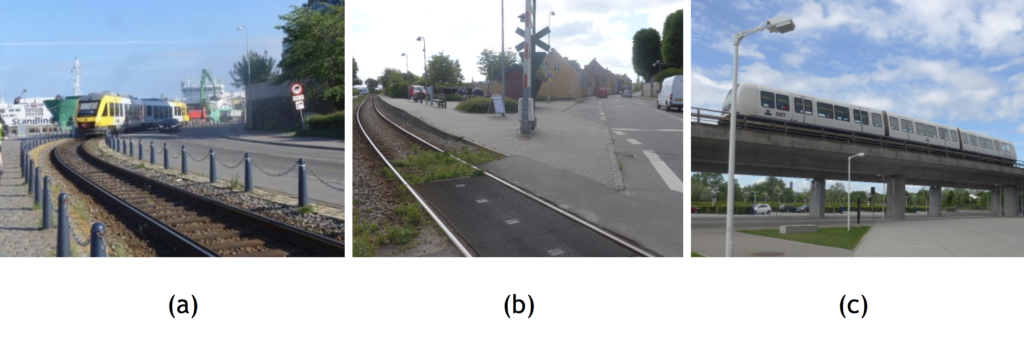
Figure 1. a) Typical Danish light diesel rail running from Helsingor to Gilleleje (25 km) soon to be electrified. b) A typical small passenger station on the line. c) A driverless, electric metro train in Copenhagen.
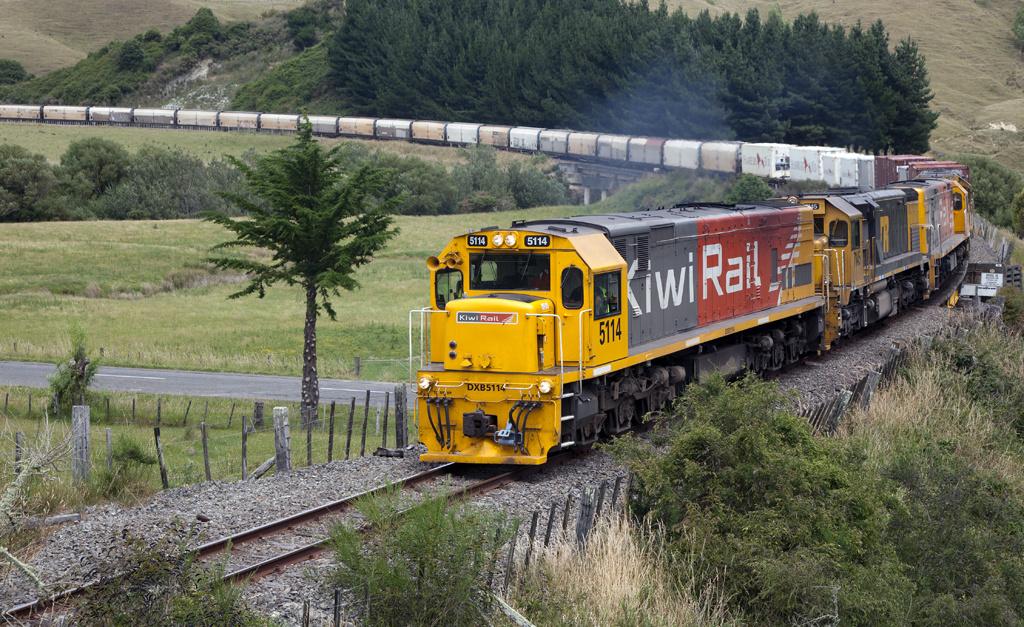
By way of contrast, Kiwirail is intending to de-electrify the main trunk line between Palmerston North and Hamilton. This is claimed to result in additional emissions from the replacement diesel locos running on this stretch of line of around 12,000t CO2 per year. This will negate all the GHG emissions savings, and more, from all the electric road vehicles currently running in New Zealand (see “Road Vehicles” section below).
Kiwirail claimed that the improved efficiency and reduced journey time from Wellington to Auckland as a result of not having to switch between diesel and electric locos twice during the journey, will attract more freight to rail from road. However, they did not state how much extra freight would be needed to neutralise the extra 12,000 t CO2 emissions from the de-electrified rail.
Based on data from the transport chapter of the IPCC 5th Assessment Report (2014) see (Table 6.3, pages 625-629), diesel rail units emit around 18-33 g CO2/tonne km of freight whereas electric rail units supplied by a power grid like New Zealand’s (with a lot of renewable electricity giving a low emissions factor of below 200g CO2/kWh) would emit 6-12 g CO2 / t km. So taking typical diesel rail emissions to be 25g CO2/t km and electric rail emissions at 8g CO2/ t km, the additional GHG emissions when going from electric to diesel will be 17g CO2 /t km. So the extra 12,000 t CO2 arising from de-electrification will result from moving around 720 million t km over the Palmerston North to Hamilton stretch of rail in a year.
Road trucks emit 270-490 g CO2/ t km depending on truck type, size, load, engine efficiency, etc. So assuming the average for trucks in New Zealand is around 380 g CO2/t km, then transferring freight from road to diesel rail would give an emission reduction of 355g CO2/t km, and 372 g CO2/t km if transferring freight from road to electric rail. (These reductions support the GHG mitigation argument to get freight off the road and on to rail of any description – or indeed from road on to coastal shipping where appropriate).
So to offset the extra 12,000t CO2 emissions arising from de-electrification would involve Kiwirail transporting around 34 million t km per year of additional freight by rail instead of road. If a typical truck’s payload is 20 t carried over an average journey of 250 km, then that equals 5000 t km for the trip. So the additional 34 million t km would equate to displacing around 6800 truck journeys a year from road to rail. If a truck makes say 100 trips a year (thereby carrying 500,000 t km/yr), then Kiwirail will need to attract the freight business from around 64 trucks to offset the extra emissions from de-electrification. These trucks could then be taken off the road.
To electrify the whole trunk line from Wellington to Auckland could be a far better option in the long term since this would go along with the world trend towards reducing GHG emissions by building more electric rail. It has been estimated by Kiwirail that this would cost around $1 billion. Compared with the recent and future investments planned for roads of national significance (the example, East/West road connection proposal in central Auckland is now estimated to cost $2 billion), that seems a relatively small investment to make to improve the rail transport system for both passengers and freight, reduce GHG emissions, and meet the vision for a net zero-carbon future by mid-century. The world has to achieve net zero-carbon by around mid-century if we are to avoid exceeding 2 degree Centigrade warming and hence the more extreme impacts resulting from climate change. New Zealand has to play its part.
Road vehicles
The Global Fuel Economy Initiative (GFEI) has shown clearly how introducing fuel efficiency standards can reduce national transport emissions over time. Around 70 countries, including emerging economies, are now members of GFEI that covers over 80% of cars sold globally. However, there has been resistance to introducing a vehicle fuel economy approach in New Zealand. The Royal Society of New Zealand report, Transition to a low carbon economy for New Zealand (2016), discussed policy options for improving fuel efficiency including “feebates”. A fee-bate system could provide the benefits of fuel efficiency standards but possibly would be better suited to New Zealand’s circumstances. When a vehicle is imported into New Zealand it would be assessed for its GHG emissions efficiency. Very efficient vehicles would get a purchase tax credit (rebate) whereas inefficient vehicles that produce more GHGs than an accepted level would have to pay a charge (fee).
Electric automobile vehicles (EVs) are increasing in number with Norway the world leader at around 130,000 in its current vehicle fleet. Compared with a similar size petrol or diesel engine powered car, each EV can avoid 2 to 3 t CO2-eq of emissions per year when running on Norway’s hydro-electricity grid or New Zealand’s electricity grid mix with over 80% renewable electricity. EVs in Australia, USA, China and elsewhere using grid electricity generated from coal-fired power stations offer little if any GHG emission reductions compared with petrol or diesel fueled vehicles. So therefore, the Kiwirail decision to de-electrify and emit an additional 12,000 t CO2 /yr will more than negate the GHG emission savings from the 3700 EVs currently running around New Zealand that Transport Minister Simon Bridges has worked so hard to encourage as a GHG mitigation solution these past two to three years. In 2016, 1451 EVs were registered, representing 0.37% of total car registrations that year. In Norway, EVs are now 28.8% of their total car fleet. So we have some way to go by comparison, and also to meet the Government’s target of 64,000 EVs on NZ roads by 2021.
In Scandinavia, there is wide support for electric vehicles, buses, rail, and cycling since government policies make owning a car a costly option. For example, in Denmark the purchase tax of 150% (recently reduced from 180%) on top of the retail price paid for a new vehicle has discouraged car ownership. At 418 cars per thousand people it is around half that of New Zealand. With retail petrol prices at a similar level to New Zealand, it is the high cost of car ownership that has also made fuel efficient, family saloons the dominant type of car on Danish roads. SUVs are rarely seen (Fig. 2), even though harsh, snowy winters are commonly experienced.
EVs are evident everywhere, particularly in Norway (as easily identified by their registration number beginning with EL or EM). The Swedish car manufacturer Volvo, has recently announced all of its cars produced from 2019 onwards will have an electric motor on board – either full electric or a plug-in hybrid. Low-carbon biofuels are also commonly used. Many Scandinavian buses are running on biogas or ethanol blends and in Sweden, a 15% ethanol blended gasoline is used by around a quarter of a million flexi-fuel vehicles.
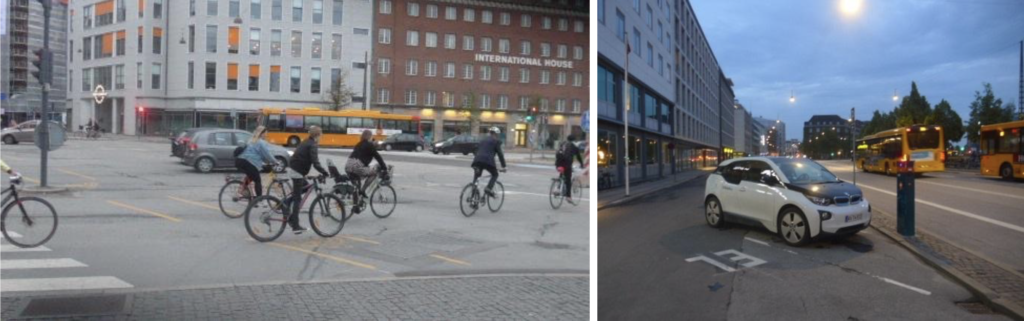
Figure 2. Street scenes at 9 pm one Friday evening in Copenhagen show a typical mix of cycles, buses and family saloon cars using the roads, with no traffic congestion and EV recharging points widely available.
Cycling infrastructure
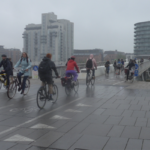
There has been some progress in developing new cycle ways in many New Zealand cities and towns over the past few years. However, investments in cycle infrastructure pale into insignificance compared with many European towns and cities, including those in Scandinavia. Many potential cyclists in New Zealand still regard the roads as too dangerous, so they continue to use their cars even for short journeys (with around a third of all journeys being less than 2 km). The converse is evident in Copenhagen, for example, where people of all ages, sizes, races, and gender use bicycles as their main form of transport in all weathers, including using cycles with large box carriers for shopping and carrying children (Fig. 3).
Some examples of the infrastructure and facilities available for cyclists are shown in Figure 3. There are strict cycle road codes enforced by the cycling community (and woe betide you in Copenhagen if you don’t keep close to the right-hand side of the cycle track, particularly when someone is intent on over-taking at speed). However, the largest difference between Scandinavia and New Zealand is the courtesy of the car and truck drivers towards their fellow road users. Even if cyclists are simply standing at an intersection idly chatting or looking at their GPS map with little intention to cross, the cars and trucks both sides of the road draw to a halt with the drivers warmly smiling. The cyclists then feel obliged to cross the road even if they don’t want to!
Figure 3.
-

- Cycles designed for carrying children, shopping etc. are common.

-
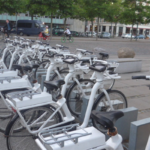
- Electric cycles available for short-term hire are gaining in popularity.
-
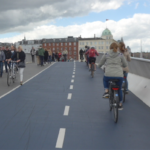
- Beautifully designed river bridges for cycles and pedestrians are used by many in both wet and dry conditions.
-
- Beautifully designed river bridges for cycles and pedestrians are used by many in both wet and dry conditions.
-
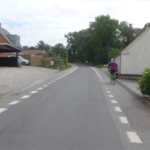
- Even narrow urban roads have cycle tracks clearly marked, which when coupled with low road speed limits of 30 km/h, are safe for all users.
-
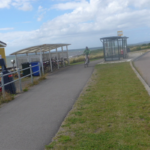
- A covered cycle parking shed at a rural bus stop with a small café nearby encourages comfortable multi-travel modes.
-
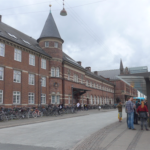
- Cycles, buses and trains enable easy inter-connections at the main Copenhagen railway stations.
-
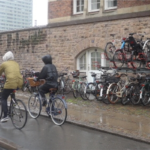
- Extensive free parking is available around all sides of the main rail station building to accommodate thousands of cycles including easy access, two-tier storage systems.
-
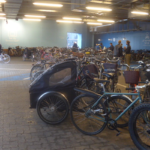
- Indoor cycle parking facilities are provided for free at key places, together with a cycle repair shop in the same facility (not shown).
-
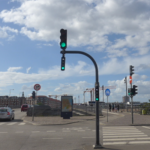
- At major intersections, cyclists have their own sets of traffic lights that all riders appear to respect.
Transport GHG emissions
It is clearly evident why Denmark, Sweden and Norway have far lower GHG emissions per capita from their transport sector than does New Zealand. The investments in infrastructure (light rail, metro, cycleways etc.) have been higher over the past decades; the national, local and regional governments have had great vision for enabling efficient mobility throughout urban and rural areas; the carbon culture of the residents through strong leadership has resulted in transport systems that are efficient and relatively low-carbon; and there are few traffic congestion problems, unlike Auckland and other New Zealand cities that in many ways are similar to Oslo, Stockholm and Copenhagen (Table 1).
It is well understood that Scandinavian countries are relatively wealthy. However, that is no excuse why New Zealand could not drive down transport GHG emissions by implementing some transport policies for a very low cost per tonne of CO2 avoided. So it is hard to fathom why we cannot learn from Scandinavian transport experiences and implement policies to change transport choice mind-sets in order to reduce GHG emissions, even if it means disrupting our love for large cars.

Leave a comment