Vulnerability to climate change is the degree to which population groups and communities are susceptible to, and unable to cope with, adverse impacts of climate change (McCarthy, Canziani, Leary, Dokken, & White, 2001). The susceptibility and coping capacity of communities relate to their liveability, socioeconomic conditions and development stages, so that any (public or private) actions addressed to mitigate climate change impacts ultimately have implications on the quality of life of those communities.
New Zealand has committed to achieving net-zero emissions by the end of this century. This net-zero target is achievable, provided that New Zealand moves onto an emission pathway consistent with lower dependency on emissions-intensive technologies, optimised land-use patterns and wider diversification of energy sources. In order to achieve that target, several scenarios have been proposed to exemplify the potential trajectories that New Zealand may take.
Trajectories involve setting actions in the near and medium future, where feedback from the economic system is dynamic and even organic because of the sensitivity of population groups towards decisions that may affect their quality of life. Many of those decisions are not cost-free and are conditional to the reaction of stakeholders. For example, farmers may be reluctant to change land use patterns or management practices because it is expensive and could take years to complete (M. A. Fernandez, 2017; Kerr & Olssen, 2012), or landowners may require a higher carbon price to compensate the opportunity cost of leaving land idle in order to preserve forests, which is linked to the existence of well-designed carbon market (M. A. Fernandez & Daigneault, 2016; M. Fernandez & Daigneault, 2016). Thus, assuming for modeling purposes that public acceptability is guaranteed may be misleading. Hence, there is the need to delve deeper into the complexity of public acceptability, that is, it is necessary to understand how vulnerability to climate change is shaped and what are the trade-offs that the public is willing to incur in order to achieve the Net Zero target.
Consequently, there is another layer of complexity for the purposes of informing climate policy. If public acceptance of climate policy is linked to changes in vulnerability, then to make informed decisions it is necessary to have a baseline assessment of vulnerability levels of population groups. Assessments improve the understanding of the factors that shape or exacerbate vulnerability (Brooks, Neil Adger, & Mick Kelly, 2005), and are helpful for scenario development regarding the potential of New Zealand to meet its obligations under the Paris Agreement.
However, assessments are not free of controversy. Assessments are built on mathematical representations of the trade-offs that the public is willing to incur between current socioeconomic conditions, climate features and potential changes induced by climate policy. The extent of those trade-offs is represented by the degree of substitution between variables and indicators. For example, in order to improve its vulnerability position a community may be inclined to promote policies that increase per-capita income as it is expected that adaptive capacity is improved and consequently hazards imposed by sea level rise or increased temperature are mitigated; another community in turn may be inclined to improve wider economic diversification (lower reliance on agriculture in rural areas) as it is expected that climatic impacts will spread on more resilient economic activities; or, it may be the case that ecosystem services (e.g. more forestry assets) should be enhanced as they reduce the sensitivity to climate impacts because of economic deprivation. Though this substitution-framework is appealing because of its simplicity, that degree of substitution is not known. Thus, we may assume or have an educated guess of that particular value, but the consequences on modeling results and policy implications are enormous. Even more, the actual (private and public) decisions taken to achieve trajectories consistent with Net Zero scenarios may affect the trade-offs, such that feedbacks between policy outcomes and population reactions occur and affect the trajectories (either positively or negatively depending on public acceptance). Hence, there is no certainty about the ultimate outcome of policies implemented.
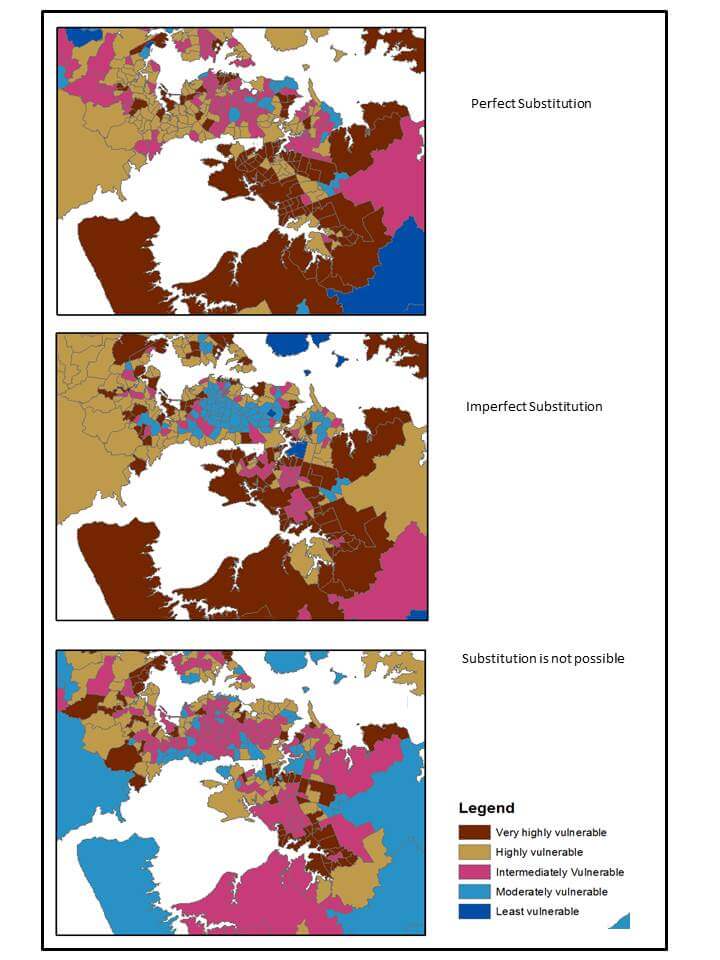
Figure 1 Fernandez, M., Bucaram, S., & Renteria, W. (2017). (Non-) Robustness of Vulnerability Assessments to Climate Change: An Application to New Zealand Title. Journal of Environmental Management2, Forthcoming.
Figure 1 shows an example of different assumed values about the degree of substitution and the consequent policy implications. Panel (a) shows the case when communities have unlimited flexibility for trade-offs. For example, lowering population density in Auckland CBD can perfectly mitigate rising sea-levels so that their vulnerability position is improved. Panel (b) shows in turn that trade-offs are limited and becomes more expensive as exposure increases or adaptive capacity decreases. Panel (c) shows, in turn, the case when communities cannot incur in any trade-off, that is, if they want to improve their vulnerability position, they first have to identify that climatic, social or economic issue where performance is the worst and make some direct intervention on it. This is the weakest-link case (Tol & Yohe, 2007).
All the three examples shown are plausible and justifiable, they have been used in reports and peer-reviewed publications. But to understand the severe implications of getting the wrong number, see yourself as a senior government officer who hires three different consultants for the same job: Assessing the vulnerability to climate change of Auckland. Now let’s compare what the consultants report for Census Area Units (AUs). Panel (a) shows that Auckland CBD is categorised as very highly vulnerable, the rest of the isthmus as intermediately vulnerable, and the Eastern Bays as moderately vulnerable. Interestingly, almost none of the Auckland AUs are in the least vulnerability category. South Auckland is between being highly and very highly vulnerable. The potential policy implication would be allocating resources to mitigate sea-level rise in the CBD and managing relative poor areas in South Auckland. Panel (b) shows in turn that the CBD (and most of the isthmus) is categorised as moderately or intermediately vulnerable. CBD waterfront areas are still categorised as very highly vulnerable, and South Auckland is between intermediately and highly vulnerable. Policy implications would in turn be focusing more on the waterfront areas of the CBD, not paying much attention to most of the AUs in the isthmus, and still focusing on the relative poor AUs of South Auckland but not on all of them. Finally, Panel (c) shows that CBD waterfront areas are categorised as moderately vulnerable and the Eastern bays as highly vulnerable. South Auckland ranges between moderately vulnerable and very highly vulnerable, that is, variability has increased. Policy implications then would be acknowledging that the CBD and the isthmus areas (except the Eastern Bays) can cope by themselves, which is almost the same situation for many AUs in South Auckland, then you should just focus on the vulnerable AUs that are scattered all around Auckland. Hence, based on these results, where should you focus more on allocating resources for mitigation and adaptation? That is, which of the three assessments should you use to analyse trade-offs communities are willing to incur?
Which of the assessments should you use to test the acceptability of the trajectories chosen to meet the Net Zero target? You, as a senior government officer, will not know how to design policies because of the uncertainty around the three reports you get from the consultants. The bottom-line is that the evidence base to support your decisions is ambiguous and weak. Scaling up to the rest of the country, uncertainty permeates all climate policy and to the best of my knowledge, there is no nationwide (and robust) vulnerability assessment to guide the necessary steps New Zealand has to take in order to reach the net-zero emissions target.
Clearly, there is a knowledge gap that researchers may find of their interest to work on.

Leave a comment